Building a distributed Maltrail sensor network using D4

Table of Contents
- Follow Along
- Setting up D4 server to receive Maltrail data
- Launch the D4 UDP exporter
- Launch the maltrail server
- Launching Maltrail / D4 sensor
- Use it
- Appendix A: Installing a Maltrail / D4 sensor
- Appendix B: Installing and Launching the Maltrail Server
Introduction
D4-core introduced a new feature recently: an analyzer to export D4 streams in UDP. This allows to send data out of a D4 server to other services that expect UDP: one such service is Maltrail. Using D4 project for building a complete distributed sensor network using Maltrail is really simple. In this blog post, we will explain all the steps and provide a VM if you want to test and evaluate the solution before deploying.
From Maltrail’s README: Maltrail is a malicious traffic detection system, utilizing publicly available (black)lists containing malicious and/or generally suspicious trails, along with static trails compiled from various AV reports and custom user defined lists.
Maltrail is based on the Traffic -> Sensor <-> Server <-> Client
architecture. Sensor(s) is a standalone component running on the monitoring
node (e.g. Linux platform connected passively to the SPAN/mirroring port or
transparently inline on a Linux bridge) or at the standalone machine (e.g.
Honeypot) where it “monitors” the passing Traffic for blacklisted
items/trails (i.e. domain names, URLs and/or IPs). In case of a positive match,
it sends the event details to the (central) Server where they are being
stored inside the appropriate logging directory (i.e. LOG_DIR described in the
Configuration section). If Sensor is being run on the same machine as
Server (default configuration), logs are stored directly into the local
logging directory. Otherwise, they are being sent via UDP messages to the remote
server (i.e. LOG_SERVER described in the Configuration section).

As communication between sensors and server are carried out over UDP, one should not push Maltrail traffic over untrusted networks without proper tunneling. Fortunately, this is exactly what D4 proposes to do: in this blogpost, we showcase how one can multiplex Maltrail Sensor<->Server communication into D4, and cross untrusted networks while guaranteeing confidentiality and authenticity of Maltrail data.
Follow Along
You can use this virtual machine to follow along.
838bc5d1a973db27ebded9a94ea3b2786b5e86d60eeffb1466e34a6fe3e48c8d D4_maltrail.ovaThe functioning of D4 requires the opening of several ports on the VM, here is the current setup after importing the .ova file into Virtual Box (VB**:
| Service | Host IP | Host port | Guest port |
|---|---|---|---|
| D4 server - Admin Web Interface | 127.0.0.1 | 7000 | 7000 |
| D4 server - ssh | 127.0.0.1 | 2222 | 22 |
| D4 server - tls d4 | 127.0.0.1 | 4443 | 4443 |
| Maltrail server | 127.0.0.1 | 8338 | 8338 |
This VM already contains all the needed D4 and Maltrail components, that we will now configure to set up a full Maltrail over D4 chain.
For testing purpose (generate HTTP traffic inside the guest VM for maltrail to do its job), we will use SSH as a SOCKS5 proxy. Fire up the VM and use a terminal to reach it from the host:
ssh -D 1337 -E /dev/null d4@127.0.0.1 -p 2222 #d4's account password is 'Password1234'.To use this proxy with any web browser, for instance chromium:
chromium --proxy-server="socks5://127.0.0.1:1337" --proxy-bypass-list="<-loopback>"You can use this terminal to interact with the VM, the SOCKS proxy will stay accessible as long as this SSH connection remains open.
Now that we have a ssh connection opened on the VM, the first step we have to perform is to retrieve the D4 admin password generated during the installation:
cat d4-core/server/DEFAULT_PASSWORDThis will output the credentials needed to connect for the first time on D4 web interface.
Setting up D4 server to receive Maltrail data
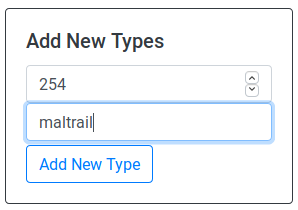
Point your (unproxied if you use the VM) web-browser to D4’s web interface (here if you use the VM). And move to the “server management” tab. Add a new 254 type and in the “Type Name” box, enter “maltrail”.

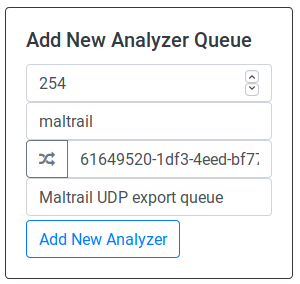
Move to the bottom of the page and create a queue for the maltrail type by clicking on the type field and entering “254”, and by clicking “Type Name” field and entering “maltrail”. Click on the UUID generator button on the left end side of this box if you don’t want to provide one by yourself.

Launch the D4 UDP exporter
This UDP exporter will ship Maltrail data out of d4 redis queue towards the maltrail server.
screen
. ~/d4-core/server/D4ENV/bin/activate
cd ~/d4-core/server/analyzer/analyzer-d4-export
./d4_export_udp.py -t maltrail -u uuid-of-your-maltrail-redis-queue -p 8337 -i 127.0.0.1
Launch the maltrail server
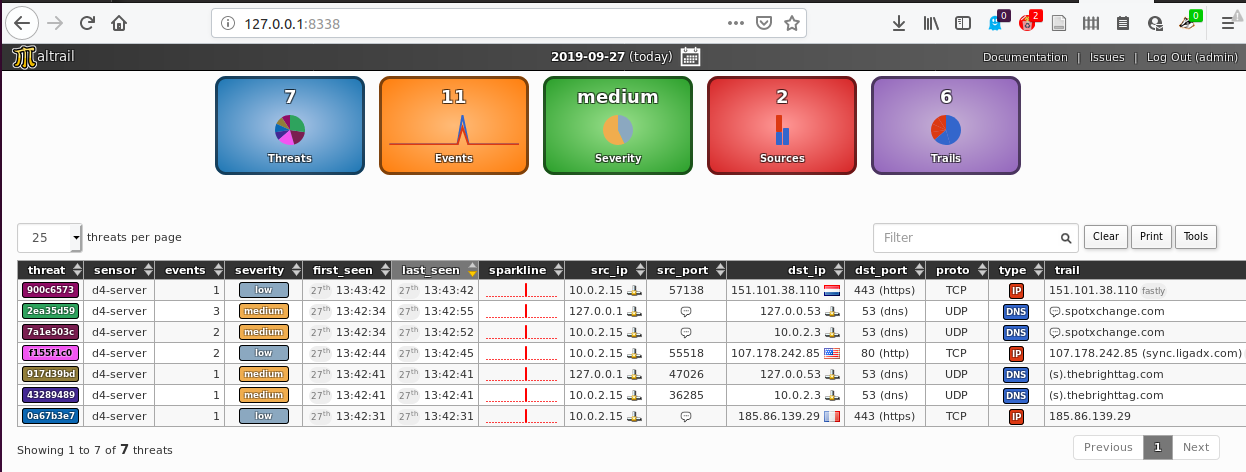
The Maltrail server will receive aggregated data from D4 and provides a web interface available at http://127.0.0.1:8338 to explore the trails (default credentials: admin:changeme!).
screen
cd ~/maltrail
sudo python server.py
Launching Maltrail / D4 sensor
First the Maltrail sensor needs to update its feeds:
screen
cd ~/maltrail
sudo python sensor.py --console
Once this is done, your sensor is ready to pipe events into D4:
sudo python sensor.py -q --console 2>&1 | d4-goclient -c ~/conf.maltrailUse it
The easiest way to ensure that the whole pipeline is in working order is to input:
ping -c 1 136.161.101.53and check in Maltrail web interface that you get an event.
For additional fun, you can use the web browser proxied by the VM, browse some ‘legit’ news website and check out maltrail output ;)


Appendix A: Installing a Maltrail / D4 sensor
sudo apt-get install git python-pcapy
git clone https://github.com/stamparm/maltrail.git
In order to ship Maltrail data with d4, we need to create the proper configuration file in d4 client’s config folder:
| parameter | description | value |
|---|---|---|
| destination | address and port of the receiving D4 server | 127.0.0.1:4443 |
| source | where to look for input data | stdin |
| snaplen | D4 packet size | 4096 |
| type | type of D4 packets sent, this is used by d4-server to know how to handle the data received | 2 |
| uuid | sensor’s unique identifier | automatically provisioned |
| key | a Pre-Shared Key used to authenticate the sensor to the server | “private key to change” |
| version | D4 protocol version | 1 |
As we chose type 2, we also need a meta-header.json file to describe the data we send:
{ "type": "maltrail" }Appendix B: Installing and Launching the Maltrail Server
From your home folder:
[[ -d maltrail ]] || git clone https://github.com/stamparm/maltrail.git
cd maltrail
In order to receive update from D4 analyzer, you need to uncomment the following lines in maltrail.conf:
# Listen address of (log collecting) UDP server
UDP_ADDRESS 127.0.0.1
#UDP_ADDRESS ::
#UDP_ADDRESS fe80::12c3:7bff:fe6d:cf9b%eno1

# Listen port of (log collecting) UDP server
UDP_PORT 8337
Then you can launch the server:
python server.pyPlease reach out to us by filling out an issue on Github if you encounter any trouble while following this tutorial.
