Observing ssh failed login attempts

Table of Contents
- Observing ssh failed login attempts
- Shipping the log to D4
- On the server
- Installing analyzer-d4-log
- Running analyzer-d4-log
- Visualizing the results
Observing ssh failed login attempts
Observing ssh failed login attempts is nothing new but yields interesting insights about what opportunistic attackers are up to. Albeit simple, maintaining such monitoring can prove challenging when one has a lot of servers to monitor.
In the following, we show how easy it is to centralize this monitoring effort to a central server that will compute and display ssh failed login attempt statistics using D4.
The advantage of such solution is to solely rely on the default logging of OpenSSH servers without the need to install honeypots or similar technologies. This model can be applied with different sources of logging.
Shipping the log to D4
Shipping the logs to D4 is really simple:
tail -n2000 -F auth.log | grep sshd | egrep "Invalid user" | /home/toto/git/d4-core/client/d4 -c /home/toto/conf-ssh/ | socat - OPENSSL-CONNECT:crq.circl.lu:4443,verify=0,keepalive=1| Command | Does |
|---|---|
| tail -n2000 -F auth.log | follow auth.log file descriptor |
| grep sshd | matches sshd |
| egrep “Invalid user” | matches ‘Invalid user’ |
| home/toto/git/d4-core/client/d4 -c /home/toto/conf-ssh | encapsulate with d4 c client |
| socat - OPENSSL-CONNECT:crq.circl.lu:4443,verify=0,keepalive=1 | ship to d4 server |
The same could actually be achieve with the go client. The type of data sent is 3: generic log line.
On the server
analyzer-d4-log is used in conjunction with a d4 server:
- The server is configured to receive type 3 streams,
- A queue should be set up to collect the streams.

Installing analyzer-d4-log
Under Ubuntu, to install analyzer-d4-log, the easiest is the clone the project’s repository and to run its installer:
git clone git@github.com:D4-project/analyzer-d4-log.git
./install_server.sh
Once the installation is finished we need to configure the analyzer by editing the config files:
| file | content |
|---|---|
| redis_d4 | address:port/database_number |
| redis_parsers | address:port/max_concurrent_access_number |
| redis_queue | uuid of the d4 queue to pop |
| http_server | not used (yet) |
Running analyzer-d4-log
Installation done, we can run the analyzer the fetch the fail login attempts and start compiling statistics:
./launch_server.shThis will create a screen session called ‘alog’ with 2 tabs:
- alog-redis: this is where the redis used by the parsers is living
- alog-ingester: this is where the analyzer itself is living.
Analyzer’s log appear in analyzer-d4-log.log.
Visualizing the results
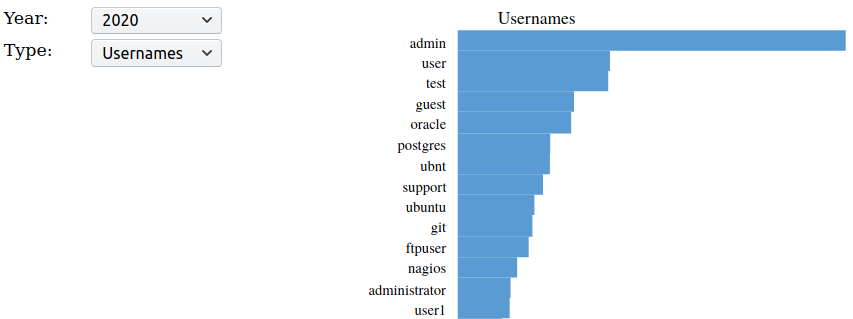
SVG graphics representing the counts are located under the data/sshd folder.
This folder also holds 3 html files to easily browse the results:
- dailystatistics.html
- monthlystatistics.html
- yearlystatistics.html

The easiest to serve these files is to fire up a python simple http server in the data folder:
cd data
python -m SimpleHTTPServer 4444
analyzer-d4-log will offer the possibility to serve the content itself in the future.
